本文实例讲述了python使用matplotlib实现在坐标系中画一个矩形的方法。分享给大家供大家参考。具体实现方法如下:
import matplotlib.pyplot as plt
from matplotlib.patches import rectangle
class annotate(object):
def __init__(self):
self.ax = plt.gca()
self.rect = rectangle((0,0), 1, 1)
self.x0 = none
self.y0 = none
self.x1 = none
self.y1 = none
self.ax.add_patch(self.rect)
self.ax.figure.canvas.mpl_connect(‘button_press_event’, self.on_press)
self.ax.figure.canvas.mpl_connect(‘button_release_event’, self.on_release)
def on_press(self, event):
print ‘press’
self.x0 = event.xdata
self.y0 = event.ydata
def on_release(self, event):
print ‘release’
self.x1 = event.xdata
self.y1 = event.ydata
self.rect.set_width(self.x1 – self.x0)
self.rect.set_height(self.y1 – self.y0)
self.rect.set_xy((self.x0, self.y0))
self.ax.figure.canvas.draw()
a = annotate()
plt.show()
如下图所示:
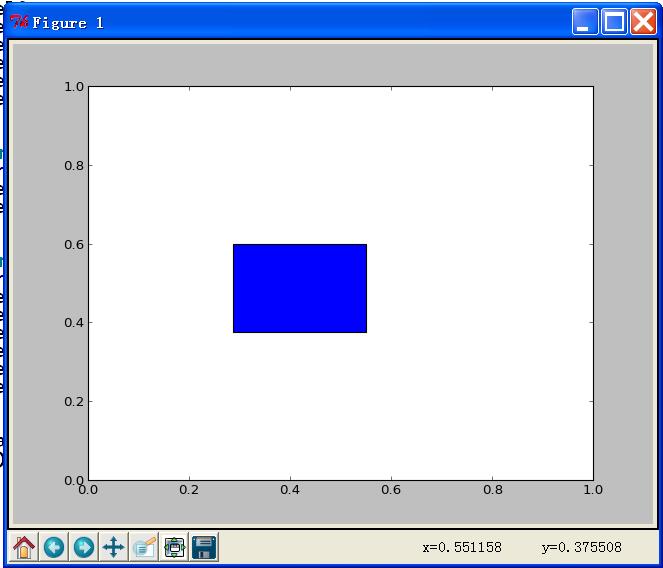
希望本文所述对大家的python程序设计有所帮助。